


Ancestor+
Copyright © APDL 2003. All Rights Reserved

Getting information out
Now we have seen how information can be put into the database we shall look at the various way you can use Ancestor+ to create charts and reports of the data.
There are no facilities for printing directly from Ancestor+. All reports and charts are created in the form of standard Acorn filetypes (text, CSV, etc.). This is much more versatile for the user, who can then print them, where required, by dragging the saved file to a printer driver or loading them into an appropriate application and printing, This is especially true in the case of textfiles, as it allows the user to set fonts, define page layout, print landscape or portrait, etc. much more easily.
Searching
If you click on the 'binoculars' button the Search Window will open. This lets you search for a particular individual or to create a 'search list', which is a list of people that have been 'found' during a search or consecutive searches. These search lists are critical to the way that Ancestor+ produces reports, exports sub-files, etc. so you need to understand how they are created.
The simplest search, finding a person by name, is very easy. There are two icons in which you can type names. Beside them are 'menu' buttons from which you can select which field(s) in the record will be searched for each name. 'Either' means that if either name is matched a find is flagged. 'Both' means that both words must match. Obviously if you only enter one word then these don't apply.
The hash symbol (#) is used as a wildcard and will match any character.
For example, to search for 'John Smith' put 'John' in the first box and set the field to 'Forename'. Now put 'Smith' in the second box and set the field to 'Surname'. Click on 'Both' and then 'Search'. If you had selected 'Either' then you would find anyone with a forename of 'John' or a surname of 'Smith'.
The fields (or names) don't have to be different. You could put slightly different versions of the same surname (eg. Smith and Smythe) in each box, select 'Surname' for each and the 'Either' button.
When searching, if you terminate a search string with a '\' then it will only find words which terminate at that point. eg. Louis' would find 'Louis', Louise', etc, but 'Louis\' will only find 'Louis', and 'Brown\' will ignore Browning, Browne, etc.
'Next' finds the next match (but see below) and 'Prev' the previous.
When a match is found the Details window for the person opens. You can use the magnifying glass button in that window to make the main display 'goto' the person if you wish. If you click on 'Add' the person is added to the 'Search list'. This is a list of people that have been 'found', and is crucial when compiling reports, exporting data, etc. If the person is already on the list clicking on 'Remove' will remove them.
'Clear' clears the search list. Repeat searches will add any 'finds' to the existing list, so it is important to remember to clear it before starting a new search.
To see the people on the list click on the 'menu' icon. If you click on someone on this menu their 'Details' window will open.
The Search list can hold up to 1,000 people, but because of memory constraints at present the menu can only display 250 names. If you have more than 250 people on the list you will not be able to use the menu.
When clicking on 'Add' or 'Remove' it's the person whose Details window was opened last that is added/removed from the list NOT the person last 'found'. Normally these would be the same as a search opens the Details window, but not always, so you need to be aware of this. This is intentional, because it means you can add any person to the list or remove them just by opening their Details window and clicking on Add or Remove without having to actually search for them.
Similarly 'Next' and 'Prev' search forward and backwards from the person whose Details window was last opened.
The 'Add all' button quickly creates a search list without needing to repeatedly click the 'Add' button. If this is selected all matches are automatically added to the search list without opening the Details window and requiring any action from the user.
Another way to add a person to the search list is to drag their number from the bottom rh corner of their 'box' to the area of the 'Add' button in the search window.
Filters
Searching for a person or people by name is all very well, but there may be times when you want a more complex search to find all the people who fit a certain profile whatever their name. This is done by using the Filters section of the search window.If you select 'Filters' or click on the 'toggle size' icon on the Search window the lower part of the Search window will appear. Because this a very powerful system it's rather complex, but it does allow very precise searches to be made.
The top section works just as before, and you can use Filters in conjunction with the top two fields to find a person or people with a certain name and some other features (eg. born or alive in a specific period) or you can leave the top fields blank and find the people who conform to the Filter characteristics regardless of name.
For the Filter to work you have to select the Filter button.
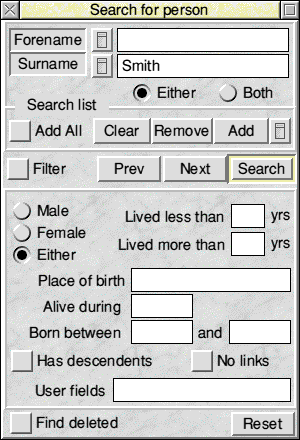
Most options are self evident, but some are mutually exclusive. The program doesn't try to second-guess the user, so be careful what you ask it to search for.
'Writable' fields are active only if you enter data in them. If blank they are ignored.
The three buttons at the top left of the area, Male, Female and Either, do what you'd expect. If Male is selected then only people defined as Male are found. If Female is selected then only people defined as Female are found.
If you enter a number in the 'Lived less than' or 'Lived more than' fields then only people who conform are found. These can be used separately (eg. to find children who died in infancy or find only people who lived longer than a certain age) or together (eg. to find everyone who died aged between 20 and 30).
Place of Birth is obvious. A 'place of death' field was considered but I didn't want to add too many complications and 'place of birth' is more likely to be useful in finding a family group.
If you enter a year in the 'Alive during' field then only people whose date of birth is before that year and date of death after it are found.
The 'Born between' fields can be used together or separately. If you enter a year in both fields then only people born between the two years are found. If you enter a year in the first field but leave the second blank then anyone born after the first date is found. If you leave the first field blank but enter a year in the second field then anyone born before the second year are found.
If 'Has descendants' is selected then only people who have children (natural or adopted) are found.
If 'No links' is selected then only people who have no links to parents or families are found. This is extremely useful for creating a list of 'spare' people in the file when you obtain more data to enable you to link these 'spare' people to others.
If there is any text in the User Field icon then all five user fields are searched for it. It would be possible to search individual fields but I think it unlikely that people will require such precision and having only one icon is a lot simpler for the user.
'Reset' just clears all the settings.
If 'Find deleted' is selected and Filters is set Deleted people are found. All other search options (except 'Add all' which works as usual) are ignored for this function. This lets you build a search list of deleted people if you want to re-use them.
Reports
The report window is opened by clicking on the right hand button on the main window button bar. This might look simpler than the earlier version but it's actually a lot more powerful.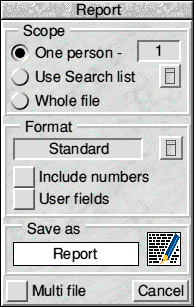
At the top is 'Scope'. This can be one person, which will be the person whose box is in the centre of the main window, the Search List (which can be viewed by clicking the 'menu' button), or the entire file.
There are four built in reports, the first four on the menu, Standard, Std + Notes, Full details and Full + Notes. All produce plain text files. Standard gives a simple report with the basic details about the person - names, date and place of birth, date and place of death, number of siblings, family links and children. Full details adds more material, showing the names of all siblings, each spouse with marriage dates, and the names of any children of each union. The 'Notes' versions of of these also add the contents of any 'Notes' file to the end of the report.
If 'Include numbers' is selected then, in standard reports, the number of each person is included. This lets you quickly find in the database anyone in a report.
If 'User fields' is selected then, again using the standard reports, the contents of all five user fields will be included.
The example report on the next page was created using 'Full + Notes'.
Normally if you compile a report on more than one person they are joined together in a single file. You may prefer that each person should be in a separate file. This is particularly useful when creating customised reports using Template files. The 'Multiple files' option puts each person's report in a separate file adding a consecutive number, starting at 001, to the filename. As RISC OS prior to RO4 does not allow filenames longer than 10 characters, if the filename you have entered has more than 7 characters it will be truncated to fit.
It is not possible to compile reports on more than 77 people using separate files with any version of RISC OS less than 4.0 as there is a limit of 77 files per directory.
Everything on the menu after the first four items is generated by a Template File. This is a very powerful and versatile system, but it can be quite complex and many users may never need it, so it is dealt with in a separate section in the Appendix.
Report on person No. 5
---------------------------------
Name              Henry Tudor
Byname
Title             King Henry VIII
Date of birth     28 Jun 1491
Place of birth    Greenwich
Date of death     28 Jan 1547
Place of death
Parents           Henry Tudor and Elizabeth York
Siblings          Arthur Tudor
                  Margaret Tudor
Family links
        Catherine Aragon
        From  11 Jun 1509 to 23 May 1533
        Children
            Mary Tudor

        Anne Boleyn
        From  28 May 1533 to 19 May 1536
        Children
            Elizabeth Tudor

        Jane Seymour
        From  30 May 1536 to 24 Oct 1537
        Children
            Edward Tudor

        Anne Cleves
        From   6 Jan 1540 to  Jul 1540
        No children recorded

        Catherine Howard
        From  28 Jul 1540 to 13 Feb 1542
        No children recorded

        Catherine Parr
        From  12 Jul 1543 to 28 Jan 1547
        No children recorded

HENRY VIII, KING OF ENGLAND AND IRELAND       1509
PRINCE OF WALES                               1503
DUKE OF YORK                                  1494

The Pope's refusal to allow Henry to divorce his first wife, Catherine
of Aragon, led to his break with Rome and his declaration to be the
supreme head of the Church in England. He suppressed the monasteries
in 1536 and 1539.
Charts
To the left of the Reports button is the Charts button. There are four types of chart, Ancestor, Descendent, Full Tree and Pedigree. The windows which appear when you select either of the first three are similar, and the Descendants window is shown. Pedigree charts are completely different and are dealt with in the next section.At the top is the person who is the starting point for the chart. This is the person in the centre of the main window unless you select 'Full tree', when the program will try to find the most distant ancestor and produce a descendant chart from that person. Next is a writable icon where you can type a line of text to form a heading.

The next icon defines how many generations are plotted. When the window opens this will be the maximum for which the chart can be drawn, and you can alter this using the 'bump' icons. Obviously you can't increase the number above the maximum.
The chart is saved by dragging the file icon after entering a filename.
Charts are created in the form of indented textfiles. It is intended to add a more ascetically pleasing format such as a Drawfile, but the advantage of the textfile is that it is very easy to read and can be quickly printed for reference or incorporated into a document.
Generations are displayed horizontally, with the options of showing dates and people's numbers (for easy cross-referencing to the main display). Horizontal spacing spreads the display out. The option chosen will depend on the number of generations and how wide your paper is. Vertical spacing puts a blank line between each person, though this isn't normally necessary.
If, instead of saving the chart, you click on the button marked 'Display' the chart is displayed in a scrolling window. The advantage of this over viewing the chart in a text editor or printing it is that if you double-click on any of the marriages or people in this window either the Family window or the Details window for that person will open. If you want to save the text file as well then if you click MENU anywhere in this window a menu will appear from which you can save the chart. More about this menu later.
When displaying a tree in this way any operations which would modify the file are disabled. You can therefore open Details or Family windows, but you can't Update the data or add new people or families.
This example descendent chart is taken from the Royal Family tree and shows from King George V to the present day.
    |-George Hanover/Windsor == Victoria Mary Teck
    |  1865-1936            1893   1867-1953
        |
        |-Edward Albert Windsor == Wallis Warfield
        |  1894-1972           1937   1896-1986
        |
        |-Albert George Windsor == Elizabeth Angela Bowes-Lyon
        |  1895-1952           1923   1900-
        |   |
        |   |-Elizabeth Alexandra Windsor == Philip Mountbatten
        |   |  1926-                     1947   1921-
        |   |   |
        |   |   |-Charles Philip Windsor == Diana Frances Spencer
        |   |   |  1948-                1981   1961-1997
        |   |   |   |
        |   |   |   |-William Arthur Windsor  1982-
        |   |   |   |
        |   |   |   |-Henry Charles Windsor  1984-
        |   |   |
        |   |   |-Anne Elizabeth Windsor == Mark Anthony Phillips
        |   |   |  1950-                1973   1948-
        |   |   |   |
        |   |   |   |-Peter Mark Phillips  1977-
        |   |   |   |
        |   |   |   |-Zara Anne Phillips  1981-
        |   |   |
        |   |   |-Anne Elizabeth Windsor == Timothy James Laurence
        |   |   |  1950-                1992   1955-
        |   |   |
        |   |   |-Andrew Albert Windsor == Sarah Ferguson
        |   |   |  1960-               1986   1959-
        |   |   |   |
        |   |   |   |-Beatrice Elizabeth Windsor  1988-
        |   |   |   |
        |   |   |   |-Eugenie Victoria Windsor  1990-
        |   |   |
        |   |   |-Edward Anthony Windsor  1964-
        |   |
        |   |-Margaret Rose Windsor == Anthony Armstrong-Jones
        |   |  1930-               1960   1930-
        |
        |-Victoria Alexandria Windsor == Henry Lascelles
        |  1897-1965                 1922   1882-1947
        |
        |-Henry William Windsor == Alice Montague-Scott
        |  1900-1974           1935   1901-
        |
        |-George Edward Windsor == Marina Greece
        |  1902-1942           1934   1906-1968
Pedigree charts
This is a type of chart that shows all the ancestors of a person. Unlike the previous charts it show just ancestors, not other relatives. The Pedigree Chart window is opened by selecting 'Pedigree' from the Charts menu, and it draws the chart from the current person. This is a rather large window, and unless your monitor is capable of displaying the desktop in 1200 x 1600 you will not be able to open it fully.Illustrated is the top half of a chart. This is taken from the example Royal Family database. As this charts only the main line most of the boxes are blank, but it serves to illustrate how the chart works.
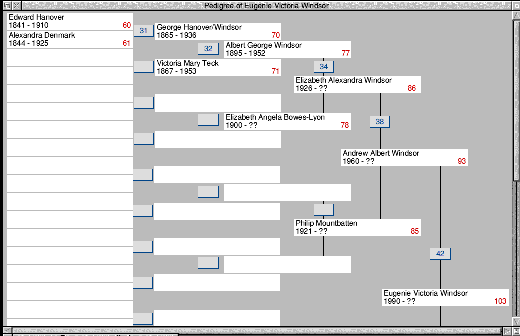
On the right hand side is the current person, and lines drawn up and down lead to her parents, Prince Andrew and, out of sight in this illustration, the Duchess of York. Each box shows the person's name and year of birth and death where known and their number. You should be able to see how the various ancestors are linked. On the vertical line leading upwards is a box with a number. This is the number of the Family associated with these three people, and if you click on it the Family Window will open. There are equivalent boxes for every family group.
If you click SELECT in one of the white boxes the display in the Main Window will change to place that person in the centre. If you click ADJUST over one of the boxes that person's Details Window will open. You can therefore display all the information about the various people and families shown in the chart.
You can move back up the tree by dragging any person's number in the corner of their box to the 'root' position box. For example, if you drag the number 70 in King George V's box near the top of the window to Princess Eugene's box the chart will be redrawn with King George as the root person.
Saving Pedigree charts
If you click MENU anywhere over the Pedigree window a menu appears. The top two items on this are 'Drawfile' and 'Text'. Sliding off either will open a window. These windows are identical, except for the file icon in the lower right hand corner.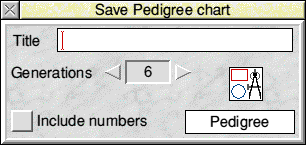
At the top is an icon in which you can enter a line of text which will appear at the top of the chart as a title. Below this is shown the number of generation that will be included. The Pedigree Window always shows six generations, but you may want the printed chart to show less, so you can use the 'bump' icons to reduce this to 5, 4 or 3 generations. If 'Include numbers' is ticked then the chart will include the people's numbers, if not they will be omitted. Unless you are printing the chart for your own reference you would not normally want numbers as they will only be applicable to the actual database in use. To save the chart just drag the file icon, Drawfile or Text, to a suitable filer window.
Below is shown the top half same chart as opposite saved as a Drawfile but with only 5 generations. All Drawfiles are scaled to fit on an A4 page.
Pedigree charts saved as plain text are cruder than Drawfile charts, but there may be times when you prefer this option. For example, they can be printed very quickly even on a slow printer. Text charts require 80 characters per line for 3 generations, 96 for 4 generations and 136 for 5 or 6 generations. This corresponds to Elite, Pica and Condensed settings on dot matrix printers. If you are viewing these charts in a text editor you must ensure that the 'width' setting is large enough or the chart will appear distorted.
Creating Reports on Pedigree charts
The third item on the Pedigree Chart Menu is 'Report'. If you click on this the usual 'Report' window opens, but most of the the top section, which normally defines the scope of the report, is 'greyed out', as the scope of the report will always be the people in the chart. The icon which normally shows the current person in the Report window now shows the number of generations the report will cover. This reflects the setting in the 'Save' windows, as it is assumed that you would wish to create matching charts and reports.Pedigree Charts and the Search List
The final item on the Pedigree Chart menu is 'Search list', and this leads to a sub-menu with two items, 'Add to list' and 'Create list'.If you click on 'Search list' the Search Window will open. You can add individual people in the Ancestor Chart to the Search List by dragging their number to the 'Add' button as you can with people's numbers in the Main Window.
As you might expect the two items on the sub-menu create a Search List containing all the people shown in the Pedigree Chart, or add all the people in the chart to an existing list. You can use this feature, for example, to create a single report This lets you create reports on all the people in a series of charts.
Exporting a 'tree'
When you have created an ancestor or descendent chart and are displaying it in its window if you click MENU over the window a menu will appear. From this menu you can do various things relating to the chart and the people and families in it.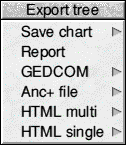
A chart will comprise a tree. It may be a complete tree, a branch of the main tree, or a section of the main tree. As Ancestor+ lets you create a tree starting at any point and containing any number of generations the variations are endless. However, any chart will be a self contained tree, and as such it can be exported. the first item on the menu will lead to a 'Save as' window from which you can save the chart itself. This is exactly the same as if you had saved it from the Charts window.
The first item on the menu leads to a Save as window from which you can save the chart itself. This is exactly the same as if you had saved it from the Charts window.
If you click on the next item, Reports, the Reports window will open. The top section of the window will be greyed out as the scope of a report produced from here will always be all the people included in the chart. All the other options and functions available for creating reports can be used. The remaining items let you save the section of the file shown in the chart in various formats, as GEDCOM, an Ancestor+ file, or HTML in either single or multi file formats. These files are a full representation of the chart, with all family links.
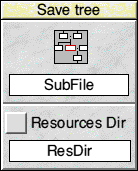
When saving a chart as an Ancestor+ file you can also create a Resources Directory for the new file and all the data in the Resources Directory for the people in the new file will be copied to it. The save window for an Ancestor+ file has an icon in which you can enter a name for the new Resources directory. You must ensure that the Resources Dir icon is selected.
APDL